GSC is indispensable and incomplete
Google Search Console is the only tool that gives you actual click, impression, position, and CTR data directly from Google. No third-party tool has this data. For SEO, it is non-negotiable.
But GSC was not designed for deep analysis. It was designed as a webmaster health check, and its data model reflects that. If you rely on GSC as your primary analytics tool (and most SEOs do), you need to understand exactly where its data falls short so you do not build strategies on gaps.
This guide covers each blind spot, why it exists, how it affects your decisions, and the workarounds available today.
Blind spot 1: Anonymized queries
Open any GSC Performance report filtered by queries. At the bottom, you will notice that the click and impression totals for individual queries do not add up to the totals at the top of the report. The gap can be significant, sometimes 20-40% of total clicks.
This is because Google strips out queries it considers too rare or too privacy-sensitive. These are not shown in the query list, not available in exports, and not accessible via the API. Google calls them “anonymized queries.”
What this means for you
- Your top queries are visible. Your long-tail is partially hidden.
- Any query-level analysis underestimates your total traffic by the anonymized share.
- Query grouping or clustering based on GSC data misses whatever falls into the anonymized bucket.
- You cannot see which pages these hidden queries land on, so some pages look like they get less query-driven traffic than they actually do.
Workarounds
Google Search Console API: Returns the same data as the UI. Anonymized queries are excluded from the API too. No advantage here.
Server-side analytics (GA4, Plausible, etc.): These tools see the landing page and the visit, but not the query. You can cross-reference landing page traffic in your analytics tool with GSC to estimate how much “dark” query traffic a page gets.
Google Ads Search Terms report: If you run paid search, the Search Terms report shows queries that triggered your ads. These include many long-tail queries that GSC hides. This is not a direct workaround, but it gives you a window into query diversity you would not otherwise have.
Accept the gap. For most sites, the visible queries cover 60-80% of total traffic. Focus your analysis on what you can see and treat the anonymized share as noise unless you have specific reasons to dig deeper.
Blind spot 2: The 1,000-row export limit
GSC’s UI exports a maximum of 1,000 rows per report. If you have more than 1,000 queries or 1,000 pages with traffic, the export truncates. You get the top 1,000 by your chosen metric and lose everything below.
For small sites, this is not a problem. For any site with moderate traffic and a few hundred pages, the limit cuts off a meaningful portion of your data.
What this means for you
- Page-level audits miss your lower-traffic pages, which are often the ones most in need of attention (thin content, decay, cannibalization).
- Query-level analysis skews toward head terms. Your mid-tail and long-tail queries are invisible in exports.
- Any report you build from a GSC export is based on an incomplete dataset without warning. The export does not tell you how many rows were omitted.
Workarounds
GSC API with pagination: The Search Analytics API returns up to 25,000 rows per request and supports pagination. For most sites, API access gives you complete (or near-complete) data. This is the most direct fix, but requires technical setup.
BigQuery export: GSC supports bulk data export to BigQuery. This gives you complete daily data with no row limit and no aggregation loss. It is the gold standard for serious GSC analysis, but it requires a Google Cloud project and some SQL knowledge.
Looker Studio: Connecting GSC to Looker Studio gives you more flexibility than the UI, but Looker Studio applies its own sampling and row limits on large datasets. It is better than the UI export but not as reliable as the API or BigQuery.
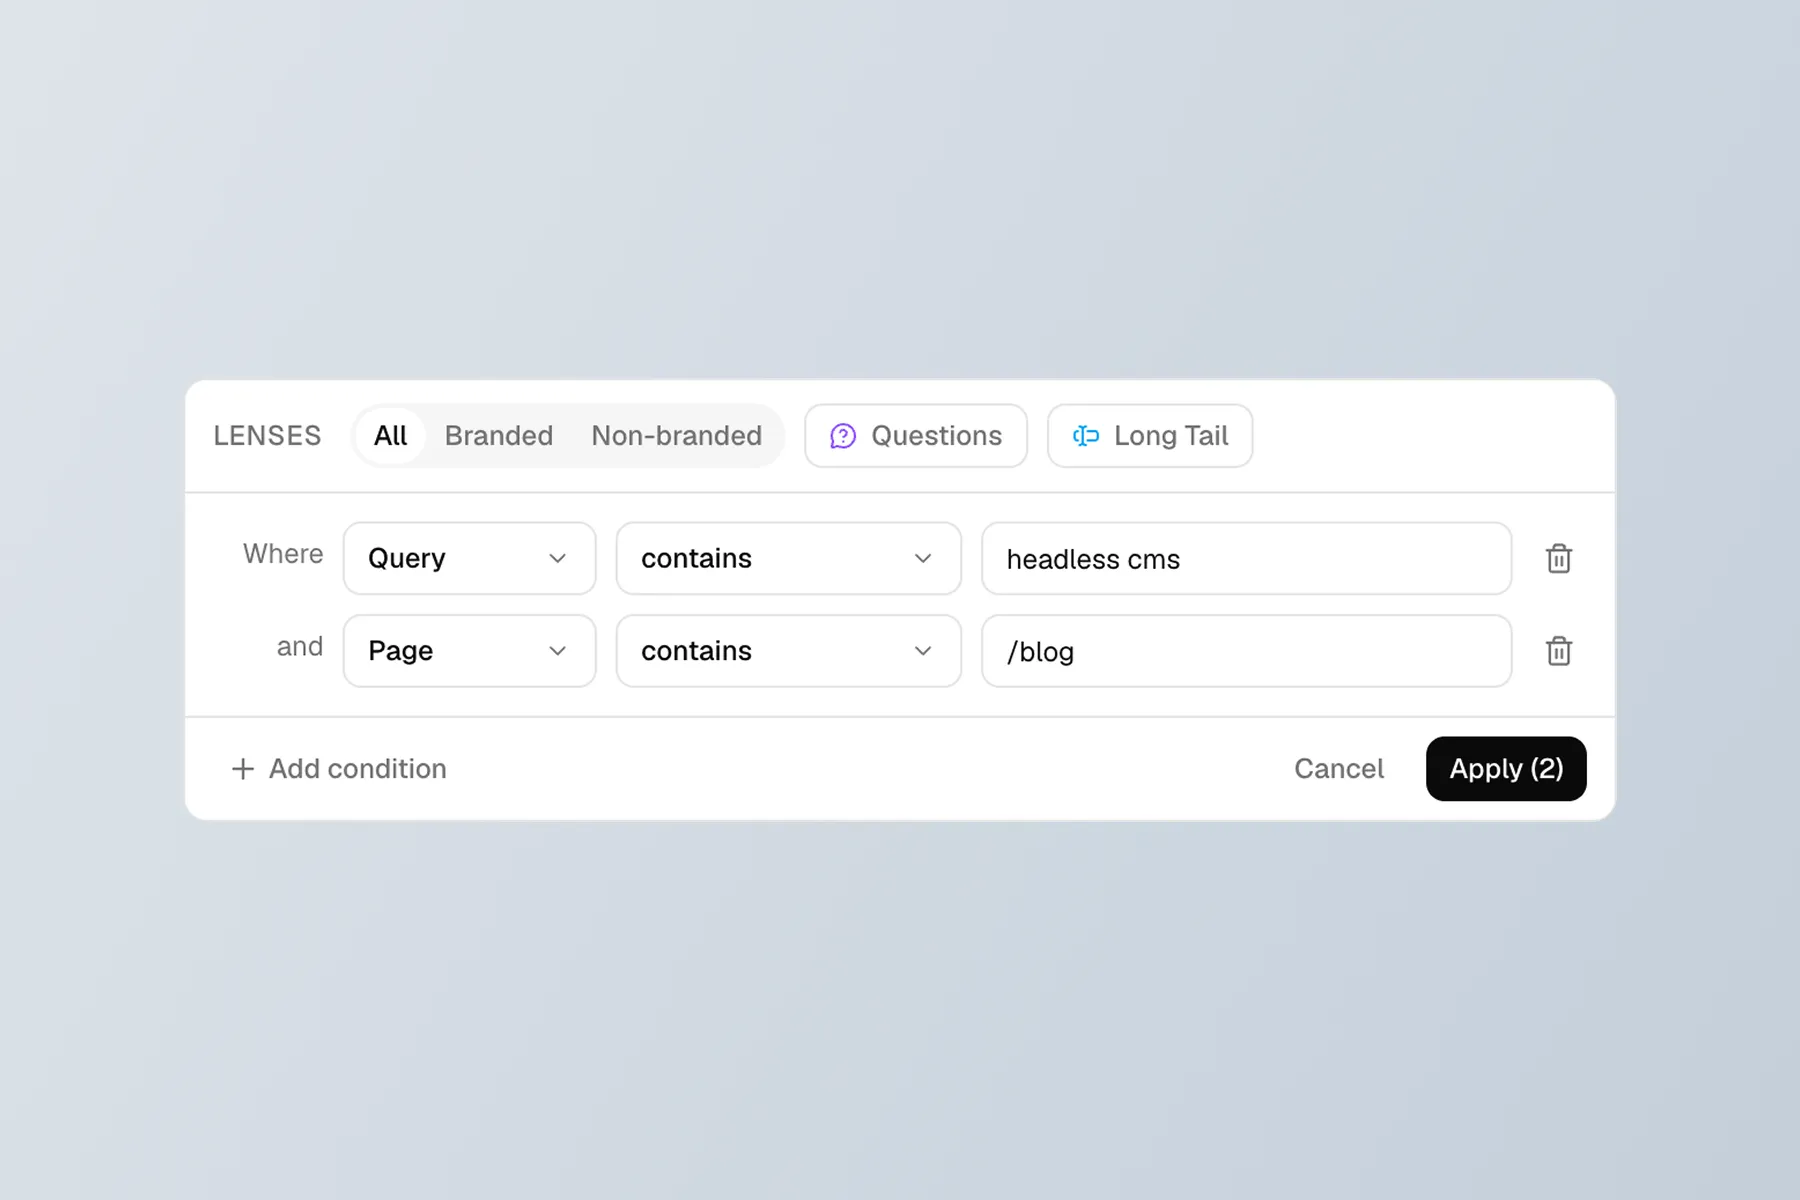
Filter before exporting. If you do not have API or BigQuery access, apply filters in GSC before exporting. Export your /blog/ pages separately from your /product/ pages, and you get 1,000 rows per segment instead of 1,000 total.
Blind spot 3: 16-month data retention
GSC keeps only 16 months of historical data. Once data ages past that window, it is gone. You cannot query it, export it, or compare against it.
For year-over-year analysis, you always have enough data. For anything longer term (tracking content lifecycle, measuring the ROI of a content investment over two years, comparing pre- and post-migration performance across a long timeline), you are out of luck.
What this means for you
- If you did not export your data regularly, you have already lost it.
- Seasonal comparisons work (16 months covers one full year plus a 4-month buffer), but multi-year trend analysis is impossible within GSC alone.
- Content decay analysis is limited to the 16-month window. A page that peaked 18 months ago has no peak in your data; it just looks like it was always declining.
Workarounds
Automated exports. Set up a weekly or monthly script that pulls data via the API and stores it in a database or BigQuery. This is the only reliable way to build a long-term GSC archive.
BigQuery bulk export. Once enabled, BigQuery export runs daily and retains data indefinitely (subject to your BigQuery retention settings). Enable it now, even if you do not plan to query it immediately. Future you will be grateful.
Third-party tools. Some SEO platforms (Ahrefs, SEMrush, and others) pull and store GSC data for you with longer retention. If you already pay for one, check whether it includes historical GSC storage.
Blind spot 4: No query-page relationship at scale
GSC shows you queries for a page, and pages for a query. But it does not show you the full matrix of query-page relationships in a single view. Every view is either page-first or query-first.
This matters when you need to understand cannibalization (multiple pages ranking for the same query), topic coverage (how many queries a page cluster covers), or content gaps (queries with impressions but no page optimized for them).
What this means for you
- Detecting cannibalization requires query-by-query investigation. There is no “show me all queries where multiple pages rank” view.
- Building topic clusters from GSC data requires manual cross-referencing between query reports and page reports.
- If you rely on the UI alone, you will miss overlap patterns that are obvious in a full dataset.
Workarounds
API + a pivot table or database. Pull the full query-page dataset via the API (dimensions: query, page), then pivot it. Group by query to find pages competing for the same terms. Group by page to see each page’s full query profile.
Dedicated tools. This is where cluster-aware tools add the most value. Instead of pivoting spreadsheets, they group queries by topic and show you which pages serve each cluster, which clusters have gaps, and where pages overlap. GSC’s UI was not designed for this; purpose-built tools are.
Blind spot 5: Sampled and delayed data
GSC data is not real-time. There is a 2-3 day reporting delay, and during processing backlogs it can stretch longer. You are always looking at the recent past, never the present.
Beyond delay, GSC applies data processing that can affect smaller datasets. Pages with very low impressions may not appear in reports at all. Query-level data is aggregated in ways that can mask day-to-day fluctuations.
What this means for you
- Do not use GSC to diagnose issues that happened yesterday. Wait at least 3 days for data to stabilize.
- Weekly reporting cadences work well with GSC’s delay. Daily dashboards built on GSC data create false urgency from processing noise.
- Small sites or new pages may not see any data in GSC for days or weeks after publishing.
Workarounds
Use server-side analytics for real-time. GA4, Plausible, or your analytics platform of choice gives you real-time traffic data. Use that for “is the site up and getting traffic right now” questions.
Use GSC for trends, not snapshots. GSC is most valuable when you look at 28-day, 3-month, or 6-month windows. Single-day data points are noisy and often misleading.
Blind spot 6: The Generative AI report gap
GSC launched a Generative AI performance report in mid-2026 that shows how your pages appear in AI Overviews. This is a meaningful addition, but the report only includes impression data. There are no clicks, no CTR, and no query-level detail.
What this means for you
- You can see which pages appear in AI Overviews, but not whether those appearances drive any traffic.
- You cannot tell whether AI Overview visibility is cannibalizing your organic clicks or adding incremental exposure.
- Any ROI calculation for AI Overview optimization is guesswork until Google adds click data to this report.
Workarounds
Cross-reference with the main Performance report. If a page has high AI Overview impressions but its organic clicks are declining for the same queries, AI Overviews may be absorbing clicks. This is indirect evidence, not proof, but it is the best signal available.
Monitor over time. Track AI Overview impressions monthly. If a page’s AI impressions grow while organic clicks shrink, the pattern becomes clearer even without direct click data.
Blind spot 7: No saved views or segments
Every time you open GSC, you start from scratch. There are no saved filters, no custom segments, no bookmarkable report configurations. If you regularly check your /blog/ pages for the last 90 days compared to the previous 90 days, you set that up manually every time.
GSC’s 2026 AI-powered natural language configuration helps here (you can type “compare blog traffic this quarter vs last year”), but it does not save the query for next time.
What this means for you
- Repeated analysis requires repeated setup. This discourages regular monitoring.
- Teams that depend on GSC for reporting waste time recreating the same filters weekly.
- Complex investigations that combine multiple filters are tedious to reproduce when you want to revisit them.
Workarounds
Looker Studio dashboards. Build a Looker Studio report connected to GSC with your segments pre-configured. This is the closest thing to saved views, though it adds Looker Studio’s own data quirks.
API-driven dashboards. Pull GSC data via the API into your own dashboard (Retool, a spreadsheet, or a custom tool). Define your segments once in code and they run automatically.
Browser bookmarks with URL parameters. GSC’s URL does encode some filter state. Bookmark your most-used filter combinations. This is brittle (Google changes URL structures), but better than manual setup every session.
What to do with all of this
GSC’s blind spots are not bugs. They are design choices for a free tool that serves millions of sites. Google is not going to expose raw query logs or offer unlimited data exports. The limitations are permanent.
The practical response is a layered approach:
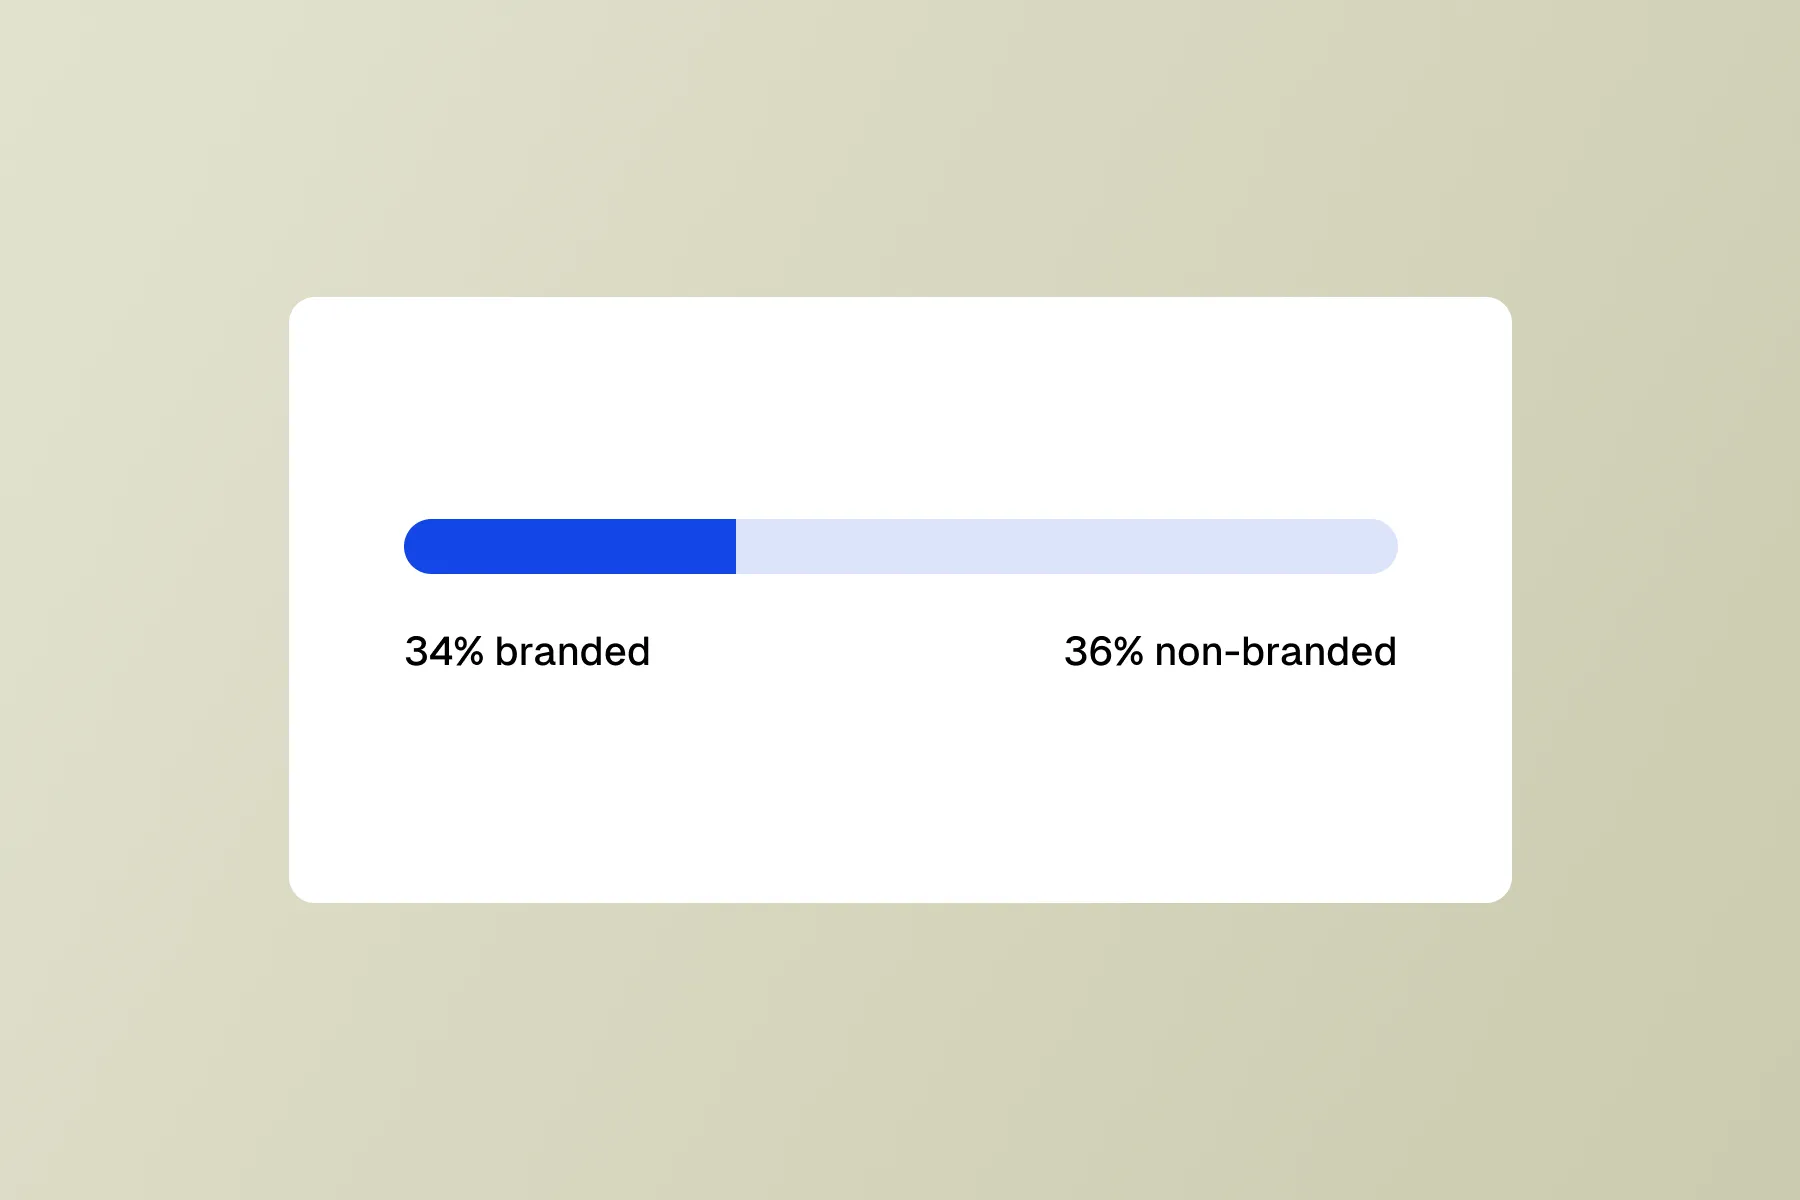
- Use GSC for what it does well: trend analysis, branded/non-branded splits, page-level diagnostics, index coverage checks. Do not fight its limitations for these tasks.
- Export and store your data. Set up BigQuery export or a weekly API pull now, before you need the historical data. The biggest regret in GSC analysis is not having started earlier.
- Use complementary tools for what GSC cannot do. Query clustering, cross-page analysis, long-term trend tracking, and real-time monitoring all require something beyond native GSC.
- Build repeatable workflows. Whether it is a Looker Studio dashboard, an API script, or a dedicated tool, invest once in setting up your most common analyses so you are not rebuilding them from scratch each time.
The goal is not to replace GSC. It is to know exactly where GSC’s picture is incomplete and have a plan for filling the gaps that matter to your decisions.